Batting average
Batting average is a statistic in both cricket and baseball that measures the performance of cricket batsmen and baseball hitters. The two statistics are related in that baseball averages are directly descended from the concept of cricket averages.[1]
Contents |
Cricket
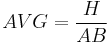
In cricket, a player's batting average is the total number of runs he has scored divided by the number of times he has been out. Since the number of runs a player scores and how often he gets out are primarily measures of his own playing ability, and largely independent of his team mates, batting average is a good metric for an individual player's skill as a batsman. The number is also simple to interpret intuitively, being approximately the average number of runs the batsman scores per innings. Batting average has been used to gauge cricket players' relative skills since the 18th century.
Most players have career batting averages in the range 5 to 50:
- Between 30 and 50 is typical for specialist batsmen and genuine all-rounders. This is also the desirable range for wicket-keepers, though some fall short and make up for it with keeping skill. Until a substantial increase in scores in the 21st century due to improved bats and smaller grounds among other factors, players who sustained an average above 50 through a career were considered exceptional.
- All-rounders who are more prominent bowlers than batsmen typically average something between 20 and 30.
- 15 and under is typical for specialist bowlers.
Career records for batting average are usually subject to a minimum qualification of 20 innings played, in order to exclude batsmen who have not played enough games for their skill to be reliably assessed. Under this qualification, the highest Test batting average belongs to Australia's Sir Donald Bradman, with 99.94. Given that a career batting average over 50 is exceptional, and that only four other players have averages over 60 (and only one over 61), this is an outstanding statistic. The fact that Bradman's average is so far above that of any other cricketer has led several statisticians to argue that, statistically at least, he was the greatest sportsman in any sport.[2]
Batting averages in One Day International (ODI) cricket tend to be lower than in Test cricket, because of the need to score runs more quickly and take riskier strokes and the lesser emphasis on building a large innings. It should also be remembered, especially in relation to the ODI histogram above, that there were no ODI competitions when Bradman played.
Batting averages are affected by the number of not-outs (innings in which the batsman has not been dismissed). For example Phil Tufnell, who was noted for his poor batting,[3] has an apparently respectable ODI average of 15 (from 20 games), despite a highest score of only 5 not out, and an overall run total of 15.
A different, and more recently developed, statistic which is also used to gauge the effectiveness of batsmen is the strike rate. It measures a different concept however – how quickly the batsman scores (number of runs from 100 balls) – so it does not supplant the role of batting average. It is used particularly in limited overs matches, where the speed at which a batsman scores is more important than it is in first-class cricket.
Leading Test batting averages ranked in order of average
(Source: Cricinfo Statsguru 22 January 2011)
| Rank | Batsman | Tests | Innings | N.O. | Runs | Highest | Ave[4] | Career dates |
|---|---|---|---|---|---|---|---|---|
| 1 | D.G. Bradman | 52 | 80 | 10 | 6996 | 334 | 99.94 | 1928–1948 |
| 2 | R.G. Pollock | 23 | 41 | 4 | 2256 | 274 | 60.97 | 1963–1970 |
| 3 | G.A. Headley | 22 | 40 | 4 | 2190 | 270* | 60.83 | 1930–1954 |
| 4 | H. Sutcliffe | 54 | 84 | 9 | 4555 | 194 | 60.73 | 1924–1935 |
| 5 | E. Paynter | 20 | 31 | 5 | 1540 | 243 | 59.23 | 1931–1939 |
| 6 | K.F. Barrington | 82 | 131 | 15 | 6806 | 256 | 58.67 | 1955–1968 |
| 7 | E.D. Weekes | 48 | 81 | 5 | 4455 | 207 | 58.61 | 1948–1958 |
| 8 | W.R. Hammond | 85 | 140 | 16 | 7249 | 336* | 58.45 | 1927–1947 |
| 9 | I.J.L. Trott | 23 | 28 | 4 | 1965 | 226 | 57.79 | 2009–Present |
| 10 | G.S. Sobers | 93 | 160 | 21 | 8032 | 365* | 57.78 | 1954–1974 |
Table shows players with at least 20 innings completed. If the qualification is removed, the highest career batting average list is topped by Andy Ganteaume, who scored 112 in his only Test innings.[5]
- denotes not out.
For more comprehensive statistics, see List of cricket batting averages.
Baseball
In baseball, the batting average (BA) is defined as the quotient of hits divided by at bats.
Henry Chadwick, an English statistician raised on cricket, was an influential figure in the early history of baseball. In the late 19th century he adapted the concept behind the cricket batting average to devise a similar statistic for baseball. Rather than simply copy cricket's formulation of runs scored divided by outs, he realised that hits divided by at bats would provide a better measure of individual batting ability. This is due to the fact that while in cricket, scoring runs is almost entirely dependent on one's own batting skill, in baseball it is largely dependent on having other good hitters on one's team. Chadwick noted that hits are independent of teammates' skills, so used this as the basis for the baseball batting average. His reason for using at bats rather than outs is less obvious, but it leads to the intuitive idea of the batting average being a percentage reflecting how often a batter gets on base, whereas hits divided by outs is not as simple to interpret in real terms.
In modern times, a season batting average higher than .300 is considered to be excellent, and an average higher than .400 a nearly unachievable goal. The last player to do so, with enough plate appearances to qualify for the batting championship, was Ted Williams of the Boston Red Sox, who hit .406 in 1941, though the best modern players either threaten to or actually do achieve it occasionally, if only for brief periods of time. There have been numerous attempts to explain the disappearance of the .400 hitter, with one of the more rigorous discussions of this question appearing in Stephen Jay Gould's 1996 book Full House.
Ty Cobb holds the record for highest career batting average with .366, 8 points higher than Rogers Hornsby who has the second highest average in history at .358. The record for lowest career batting average for a player with more than 2,500 at-bats belongs to Bill Bergen, a catcher who played from 1901 to 1911 and recorded a .170 average in 3,028 career at-bats. The modern-era record for highest batting average for a season is held by Napoleon Lajoie, who hit .426 in 1901, the first year of play for the American League. The modern-era record for lowest batting average for a player that qualified for the batting title is held by Rob Deer, who hit .179 in 1991. While finishing six plate appearances short of qualifying for the batting title, Adam Dunn of the Chicago White Sox hit .159 for the 2011 season, twenty points (and 11.2%) lower than the record. The highest batting average for a rookie was .408 in 1911 by Shoeless Joe Jackson.
For non-pitchers, a batting average below .230 is often considered poor, and one below .200 is completely unacceptable. This latter level is known as "The Mendoza Line", named for Mario Mendoza, a stellar defensive shortstop who hit .215 during his Major League career. The league batting average in Major League Baseball for 2004 was just higher than .266, and the all-time league average is between .260 and .275.
Sabermetrics, the study of baseball statistics, considers batting average a weak measure of performance because it does not correlate as well as other measures to runs scored, and because it has little predictive value. Batting average does not take into account walks or power, whereas other statistics such as on-base percentage and slugging percentage have been specifically designed to measure such concepts. Adding these statistics together form a player's On-base plus slugging or "OPS". This is commonly seen as a much better, though not perfect, indicator of a player's overall batting ability as it is a measure of hitting for average, hitting for power and drawing bases on balls.
In 1887, Major League Baseball counted bases on balls as hits. The result of this was skyrocketed batting averages, including some near .500, and the experiment was abandoned the following season.
Qualifications for the batting title
The Major League Baseball batting average championship (often referred to as "the batting title") is awarded annually to the player in each league who has the highest batting average. Ty Cobb holds the MLB (and American League) record for most batting titles, officially winning 11 in his pro career.[1] The National League record of 8 batting titles is shared by Honus Wagner and Tony Gwynn. Most of Cobb's career and all of Wagner's career took place in what is known as the Dead-Ball Era, which was characterized by higher batting averages and much less power, whereas Gwynn's career took place in the Live-Ball Era.
To determine which players are eligible to win the batting title, the following conditions have been used over the sport’s history[6]:
- Pre-1920 – A player generally had to appear in 100 or more games when the schedule was 154 games, and 90 games when the schedule was 140 games. An exception was made for Ty Cobb in 1914, who appeared in 98 games but had a big lead and was also a favorite of League President Ban Johnson.
- 1920–1949 – A player had to appear in 100 games to qualify in the National League; the AL used 100 games from 1920–1935, and 400 at-bats from 1936–1949. The NL was advised to adopt 400 at-bats for the 1945 season, but League President Ford Frick refused, feeling that 100 games should stand for the benefit of catchers and injured players. (Taffy Wright is often erroneously said to have been cheated out of the 1938 batting title; he batted .350 in exactly 100 games, with 263 ABs. Jimmie Foxx hit .349, in 149 games and 565 AB. But since the AL requirement that year was 400 at-bats, Foxx's batting title is undisputed.)
- 1950–1956 – A player needed 2.6 at bats per team game originally scheduled. (With the 154-game schedule of the time, that meant a rounded-off 400 at-bats.) From 1951–1954, if the player with the highest average in a league failed to meet the minimum at-bat requirement, the remaining at-bats until qualification (e.g., 5, if the player finished the season with 395 ABs) were hypothetically considered hitless at-bats; if his recalculated batting average still topped the league, he was awarded the title. This standard applied in the AL from 1936–1956.
- 1957 to the present – A player has needed 3.1 plate appearances per team game originally scheduled; thus, players were no longer penalized for walking so frequently, nor did they benefit from walking so rarely. (In 1954, for example, Ted Williams batted .345 but had only 386 ABs, while topping the AL with 136 walks. Williams thus lost the batting title to Cleveland’s Bobby Avila, who hit .341 in 555 ABs.) In the 154-game schedule, the required number of plate appearances was 477, and since the era of the 162-game schedule, the requisite number of PAs has been 502. (Adjustments to this 502 PA figure have been made during strike-shortened seasons, such as 1972, 1981, 1994, and 1995.)
From 1967 to the present, if the player with the highest average in a league fails to meet the minimum plate-appearance requirement, the remaining at-bats until qualification (e.g., 5 ABs, if the player finished the season with 497 plate appearances) are hypothetically considered hitless at-bats; if his recalculated batting average still tops the league, he is awarded the title. (This policy was invoked in 1981, securing Bill Madlock his third NL batting crown, and in 1996, when NL titlist Tony Gwynn finished the year with only 498 PAs.)
All-time leaders
| # | Player | Avg [7] | Team(s) | Year(s) |
|---|---|---|---|---|
| 1 | Ty Cobb | .367 | Detroit, Philadelphia (AL) | 1905–28 |
| 2 | Rogers Hornsby | .358 | St. Louis (NL), New York (NL), Boston (NL), Chicago (NL), St. Louis (NL), St. Louis (AL) | 1915–37 |
| 3 | Shoeless Joe Jackson | .356 | Philadelphia (AL), Cleveland, Chicago (AL) | 1908–1920 |
| 4 | Lefty O'Doul | .349 | New York (AL), Boston (AL), New York (NL), Philadelphia (NL), Brooklyn | 1919–23, 1928–34 |
| 5 | Ed Delahanty | .346 | Philadelphia (NL), Cleveland (PL), Philadelphia (NL), Washington | 1888–1903 |
| 6 | Tris Speaker | .345 | Boston (AL), Cleveland, Washington (AL), Philadelphia (AL) | 1907–28 |
| 7 | Ted Williams | .344 | Boston (AL) | 1939–42, 1946–60 |
| 8 | Billy Hamilton | .344 | Kansas City (AA), Philadelphia (NL), Boston (NL) | 1888–1901 |
| 9 | Dan Brouthers | .342 | Troy, Buffalo, Detroit (NL), Boston (NL), Boston (PL), Brooklyn (NL), Baltimore (NL), Louisville, Philadelphia (NL), New York (NL) | 1879–96, 1904 |
| 10 | Babe Ruth | .342 | Boston (AL), New York (AL), Boston (NL) | 1914–35 |
Other contexts
Following from usage in cricket and baseball, batting average has come to be used for other statistical measures of performance and in the general usage on how a person did in a wide variety of actions.
An example is the Internet Archive, which uses the term in ranking downloads. Its "batting average" indicates the correlation between views of a description page of a downloadable item, and the number of actual downloads of the item. This avoids the effect of popular downloads by volume swamping potentially more focused and useful downloads, producing an arguably more useful ranking.
References
- ^ a b "Baseball Statistics". Cosmic Baseball Association. http://www.cosmicbaseball.com/bstats17.html. Retrieved 2007-10-29.
- ^ "Sir Donald Bradman". Players and Officials. Cricinfo.com. http://content-uk.cricinfo.com/australia/content/player/4188.html. Retrieved 2006-04-27.
- ^ Cricinfo – The Jack of all rabbits
- ^ "Test Career Highest Batting Averages". Cricinfo. http://www1.cricinfo.com/db/STATS/TESTS/BATTING/TEST_BAT_HIGHEST_AVS.html. Retrieved 2007-02-15.
- ^ "Statsguru - Test matches - Batting average (descending)". Cricinfo. http://stats.cricinfo.com/statsguru/engine/stats/index.html?class=1;orderby=batting_average;template=results;type=batting. Retrieved 9 August 2009.
- ^ Leaderboard Glossary – Baseball
- ^ "Career Leaders for Batting Average". Baseball Reference. http://www.baseball-reference.com/leaders/BA_career.shtml. Retrieved 2007-01-30.
|
||||||||||||||||||||
|
||||||||||||||